


The Re-Leveraging of America
- Jan 8, 2019
- 8 min read
We have passed the tenth anniversary of the collapse of the U.S. subprime mortgage market and the resulting Financial Crisis. Lehman Brothers failed on September 13, 2008 and many treat this date as the start of this great catastrophe.
Despite the tremendous social, financial and human consequences of the crisis, there is little consensus on the causes of the market collapse and Great Recession. For example, inherent in the regulatory stress tests required of large banks is the assumption that changes in the macro-economy determines changes in the performance of banks. CCAR and DFAST, for example, are predicated on the notion that significant economic contraction—the Severely Adverse scenario, for example--precipitates defaults and losses on loans, reductions of income to banks, and calls on bank capital. Capital ratios that exceed the “Well-Capitalized” standards in severe recessions are and increasingly important measure regulators use to ensure the soundness of the banking system.
I take a different view. I believe that growth in debt that exceeds the growth in the economy is the ultimate determinant of credit crises and the contraction of that excess capital is the root cause for massive defaults and losses that characterize these crises.
I have argued elsewhere that rapid growth in debt, particularly debt growth in excess of economic growth, is a major cause of credit crises through the modern history of the U.S(1). Specifically, when the expansion of debt markets exceeds the overall growth in the economy, that debt flows to increasingly risky borrowers, so-called non-investment grade or subprime borrowers. This flow of capital typically occurs because lenders relax underwriting standards to maintain the growth of their revenues. This is a period of ebullience or 'irrational exuberance" even though subprime borrowers have exponentially greater probabilities of default than their prime or investment grade counterparts leading to ever greater risk that they will default.
When defaults of sub-prime borrowers do emerge, lenders become risk averse, tighten underwriting standards and invest in risk-free instrument such as Treasury Bonds. In doing so, they withdraw risky capital from the markets and this withdrawal puts further pressure on weaker borrowers that may have relied on lines of credit or other forms of debt to supplement weak operating cash flows. Credit contraction, then, elevates probabilities of default and actual rates of default.
These ideas are the Excess Capital Hypothesis (ECH). (Promo: please feel free to visit thebrucegstevensoncompany.com for copies of papers I have written on this subject.)
A key element of the ECH is the growth of debt relative to Gross Domestic Product (GDP), as shown in Figure 1. In this chart, I plot two measures of the system-wide growth in debt. First is the total sum of loans and debt securities outstanding in the U.S. divided by nominal GDP and second is total loans and leases divided by GDP(2).

Figure 1. Growth of Debt Relative to Gross Domestic Product in the United State, 1970 to 2018
We can see that both measures increase dramatically from the 1970s though to 2008, especially in the 1990’s. Notably, the large jump in the ratio of bonds and loans to GDP (blue line in Figure 1) stems from the emergence of the non-investment grade bond market in the early and mid-1980s with the creation of junk bonds that financed both hostile and friendly corporate takeovers in that decade.
This measure of total debt in the U.S. markets grew in excess of GDP steadily all the way to the second quarter of 2009, at the height of the Financial Crisis. It subsequently contracted by nearly 9% when it reached a recent low in the fourth quarter of 2015. This is the “flight-to-quality” that dominated the markets in the immediate aftermath of the Lehman bankruptcy.
Loans and leases relative to GDP (orange line) is much more sensitive indicator of the ECH (Figure 1). For example, there is a noticeable buildup of loans in the second half of the 1980’s and sharp decline at the end of that decade into the first years of the 1990s. This pattern is the boom and bust of commercial real estate markets that gave rise to the failure of banks and savings and loans especially on the east and west coasts where CRE investment had been greatest.
Figure 1 also shows a very dramatic buildup in the ratio of loans to GDP in the late 1980s to the 1990s and especially to the mid-2000s. The latter period, of course, was the heyday of the mortgage markets, including “low-doc” or “no-doc” mortgages targeted to subprime borrowers and destined for mortgage-backed back securities.
Loans to GDP reaches its maximum in the first quarter of 2009 and contracted by 14% to a recent low in the fourth quarter of 2013.
So, what do we make of the ECH other than it’s a group of interesting ideas? Well, when I look at Figure 1, I have a sense of déjà vu all over again. Loans and debt securities have stabilized as a percent of GDP, meaning that any de-leveraging that took place after the Financial Crisis has stopped according to this measure. Loans and leases to GDP shows that the post-crisis de-leveraging ceased at the end of 2013 and, as of the end of 2016, was only 4 below its peak value at the end of 2009.
It seems that America’s borrowing habits have returned.
In fact, there’s lots of anecdotal evidence that America is re-leveraging and it is subprime customers that are borrowing most actively. Let’s take a quick look at three asset classes of subprime loans.
Subprime Mortgages. Recently, CNBC reported that many potential home buyers are enrolling in programs that offer zero-down-payment, subprime mortgages, with 15- or 20-year terms and below-market interest rates (3). These mortgages are not as risky as the worst available before the Financial Crisis, since borrowers in these new loans must submit all necessary documents to ensure underwriting of their loan, from income statements to phone bills. Further, borrowers can have low credit scores, but have to go through an education session about each program as well as counseling to understand their monthly budget and ensure they can afford the mortgage payment.
But, the subprime mortgage is back.
Surprisingly, publicly-available data on delinquencies and defaults on subprime mortgages are scarce so it is not possible to test the ECH hypothesis that rising levels of subprime mortgage debt are a leading indicator of those delinquencies and defaults.
Subprime Auto Loans. Subprime auto loans increased as well in early 2018, even in the face of rising defaults, according to a Bloomberg article published in February(4). In fact, as of the first quarter of 2018, total auto loans were up more than 70 percent since 2010 and much this growth was fueled by bonds backed by the auto loans that were in strong demand by institutional investors looking for yield, at least through the first part of the year. This growth continued in the third quarter when subprime auto loan originations were up 10% year-over-year(5).
In a September 2018 article, the Motley Fool sang the praises of sub-prime auto lender Credit Acceptance Subprime (equity value up 37%) that has been a big beneficiary of the strong U.S. economy and rising auto prices(6). In fact, new auto lenders that are backed by private equity explicitly target sub-prime borrowers. One of the riskier ABS deals was originated by Honor Finance of Evanston, Illinois, which is majority-owned by CIVC Partners, a Chicago-based private equity firm. In its first transaction ($100 million offered in December 2016), two-thirds of the borrowers had FICO scores below 550 and one-quarter of the borrowers had no FICO score at all.
All of this growth in auto loans prompted some observers to declare that an asset bubble was emerging in sub-prime auto lending. Did anyone say “originate for distribution”?
Consistent with the ECH, delinquencies and defaults among auto loans are rising. Auto finance defaults rose to a peak of 0.95 percent on the S&P/Experian Consumer Debt Index in August 2107 and it has remained at or near this level through October. Further, in July, Standard & Poor’s downgraded the class C bonds in the Honor Finance transaction to CCC+ from BB-, reflecting S&P’s estimate that the class C notes could incur write-offs totaling 2%.
Lenders are taking notice and responding. In a mid-year Industry Insights Report published by TransUnion, the share of auto loans extended to sub-prime borrowers shrank as a result of tightened lending standards(7). This tightening aligns with the ECH that predicts credit contraction when delinquencies and defaults emerge.
Sub-Prime Credit Cards. In the first quarter of 2018, the delinquency rate on credit-card loans at the 4,788 smaller banks in the US spiked in to 5.9%(8). This rate exceeds the peak during the Financial Crisis. And the credit-card charge-off rate at these banks spiked to 8% and this level neared the peak during the Financial Crisis.
Across all commercial banks, the delinquency rate was 2.54%. This rate was pushed down by the largest 100 banks, whose combined delinquency rate in Q1 was 2.48%.
These large banks have been offering incentives to consumers with higher credit ratings and they've been following good underwriting practices. This conservative approach is now helping to keep losses down. Smaller banks couldn't compete with those offers and so they moved into subprime with weaker underwriting. Approaching the market in this manner, they were able to obtain new credit-card customers that the big banks didn't want. These new customers used their credit lines even though the interest rates on the cards were very high.
We can see in Figure 2, there is close correlation between the level of revolving credit relative to GDP and the level of credit card delinquencies, as predicted by the ECH. From the end of 1994 through the third quarter of 2018, the delinquency rate on credit cards closely matched changes in the level of revolving credit relative to GDP, albeit with a lag(9).
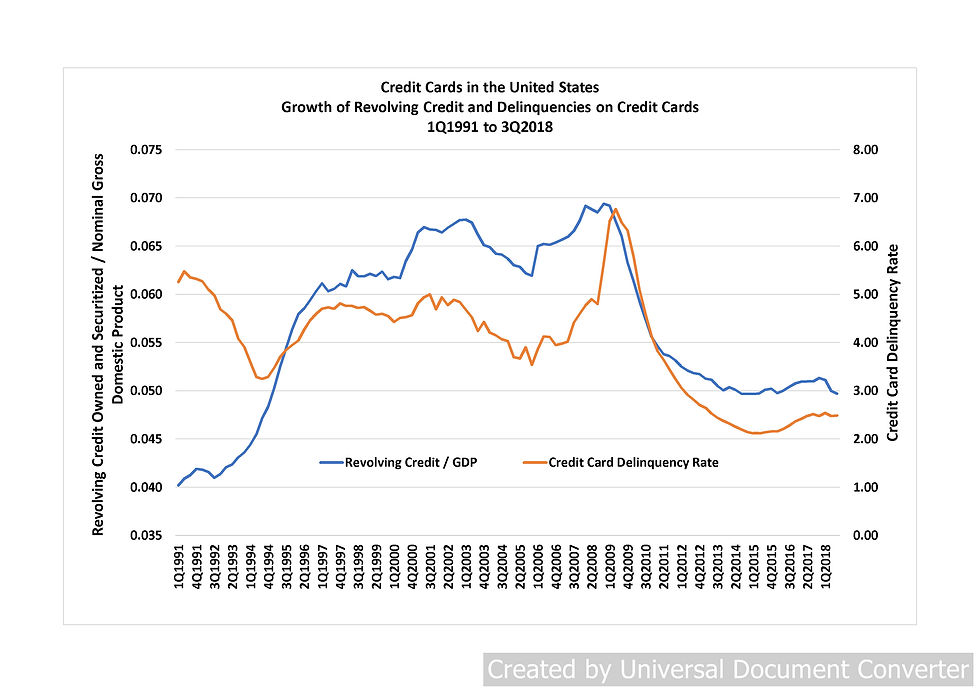
Figure 2. Growth of Revolving Credit and Delinquencies on Credit Cards, 1Q1991 to 3Q2018.
What do we make of this re-leveraging?
For the moment, the actual increases in debt are partially masked by rapid economic growth. Over the four quarters ending in 3Q2018, nominal GDP has increased by an average of 5.5% annualized and real GDP has increased by an average of 3.0%. This growth means that the economy appears to have the capacity to absorb increases in debt. However, should the economy slow then marginal borrowers may be at increased risk of default.
If you’re a banker, now might very well be the time to conduct of review of your firm’s underwriting standards and risk ratings for individual borrowers. If the economy slows or even contracts, the subprime borrowers in your portfolio are the ones most likely to deteriorate.
I strongly recommend that each bank implement these portfolio management steps gradually. Sudden withdrawal of credit precipitated by rapid tightening of underwriting standards will remove credit from those borrowers (subprime) that need it most, further exacerbating their already increasing probabilities of default. The “shock effect” of sudden tightening and loosening was clearly evident in the Financial Crisis and the period leading up to it (Figure 3) and, according to the ECH, was a contributing factor to that crisis.
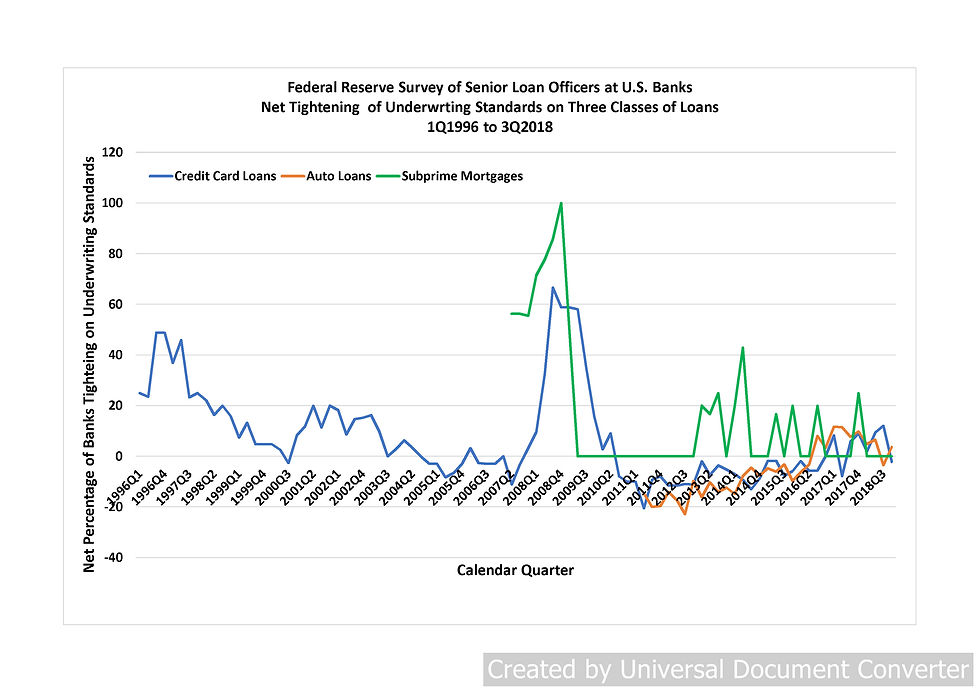
Figure 3. Historical Changes in Tightening and Loosening of Bank Underwriting Standards as Reported in the Federal Reserve’s Survey of Senior Loan Officers, 1Q1996 to 3Q2018.
Today, banks are in a gradual mode of tightening underwriting standards (Figure 3), though mild by historical standards. There is room for further such tightening, a move I recommend.
Finally, the new Current Expected Credit Loss (CECL) standard for accounting for loan losses may aid this portfolio management in the following sense: as an individual borrower weakens, its credit quality deteriorates and its risk rating increases. Most importantly, the borrower’s default probability and its expected loss (EL) increase geometrically as its credit deteriorates. Since CECL requires lenders to set aside loan loss provisions in proportion to EL, the provisions for this borrower will increase geometrically since the borrower’s default probability increases exponentially as its risk rating increases. Bankers are likely to limit exposure to subprime borrowers due to the increased expense of the CECL loan loss provisions.
Whether CECL will allow these actions to take place gradually remains to be seen.
(1) Stevenson, B. G. 2010. Credit crises: The excess capital hypothesis. Bank Accounting & Finance, October-November: 39-51.
(2) I use nominal GDP rather than real GDP since the numerator of these ratios is not adjusted for inflation.
(3) These programs are run by the nonprofit, Boston-based brokerage Neighborhood Assistance Corporation of America, or NACA. https://www.cnbc.com/2018/10/12/thousands-line-up-for-zero-down-payment-subprime-mortgages.html
(4) https://www.bloomberg.com/news/articles/2018-02-02/never-mind-defaults-debt-backed-by-subprime-auto-loans-is-hot
(5) https://www.autonews.com/article/20181121/FINANCE_AND_INSURANCE/181129967/subprime-originations-rise-for-the-first-time-in-two-years
(6) https://www.fool.com/investing/2018/09/12/this-subprime-auto-lender-is-up-37-in-2018-heres-w.aspx
(7) https://www.wardsauto.com/dealers/subprime-lending-decreases-consumer-credit-scores-increase
(8) The 100 largest banks are excluded from this group. https://schiffgold.com/key-gold-news/sub-prime-credit-card-delinquency-rates-rise-above-financial-crisis-peak/
(9) The Pearson correlation measured without a lag between these two variables over the period 4Q1994 to 3Q2018 is 0.843. This correlation changes to 0.857 if revolving credit to GDP is lagged by one quarter and it changes to 0.858 of revolving credit to GDP is lagged by two quarters.
Comments